Poisson equation (horizontal case)
21 December 2020 by MiniUFO
1. Introduction
One of the classical inversion problem is to solve for a streamfunction \(\psi\) given the vertical component of vorticity \(\zeta\) and proper boundary conditions:
This is the form in cartesian coordinates. In spherical coordinates (\(\lambda\), \(\phi\), \(z\)), it is written as:
where \(r=\cos\phi\). Note that this should be modified slightly to fit the solver as:
2. Example: Helmholtz decomposition
This is a classical problem in both meteorology and oceanography that a vector flow field can be deomposed into rotational and divergent parts (known as Helmholtz decomposition), where rotational and divergent parts are represented by the streamfunction \(\psi\) and velocity potential \(\chi\) as:
Given vorticity (\(\zeta\)) and divergence (\(\eta\)) as the forcing functions respectively in Eqs. (1) and (2) (i.e., two Poisson equations), one can invert the streamfunction \(\psi\) and velocity potential \(\chi\) using SOR iteration method.
2.1 Atmospheric demonstration
Here is an atmospheric demonstration with no lateral boundaries. First, we load in vorticity data from a file:
[1]:
import sys
import xarray as xr
sys.path.append('../../../')

ds  = xr.open_dataset('../../../Data/Helmholtz_atmos.nc')
vor = ds.vor

print(ds)
<xarray.Dataset> Size: 505kB
Dimensions:  (time: 2, lat: 73, lon: 144)
Coordinates:
  * time     (time) datetime64[ns] 16B 2008-01-01 2008-01-02
  * lat      (lat) float32 292B -90.0 -87.5 -85.0 -82.5 ... 82.5 85.0 87.5 90.0
  * lon      (lon) float32 576B 0.0 2.5 5.0 7.5 10.0 ... 350.0 352.5 355.0 357.5
Data variables:
    u        (time, lat, lon) float32 84kB ...
    v        (time, lat, lon) float32 84kB ...
    div      (time, lat, lon) float32 84kB ...
    vor      (time, lat, lon) float32 84kB ...
    sf       (time, lat, lon) float32 84kB ...
    vp       (time, lat, lon) float32 84kB ...
Attributes:
    comment:  uwnd anomaly
    storage:  99
    title:    plumb_flux
    undef:    99999.0
    pdef:     None
Inverting the streamfunction, within lat/lon plane but loop over time dimension, is as simple as:
[2]:
from xinvert import invert_Poisson

iParams = {
    'BCs'      : ['extend', 'periodic'],
    'mxLoop'   : 1000,
    'tolerance': 1e-12,
}

sf = invert_Poisson(vor, dims=['lat','lon'], iParams=iParams)
{time: 2008-01-01T00:00:00} loops 1000 and tolerance is 2.740131e-09
{time: 2008-01-02T00:00:00} loops 1000 and tolerance is 5.946044e-09
Notice that this is a global case, so the zonal boundary condition is periodic. Meridional extend boundary condition allows streamfunction to variate near the poles. The result can be visualized as:
[11]:
import ultraplot as uplt
import xarray as xr
import numpy as np

# select the first time step
u = ds.u.where(ds.u!=0)[0].load()
v = ds.v.where(ds.v!=0)[0].load()
m = np.hypot(u, v)
fontsize = 13

fig, axes = uplt.subplots(nrows=2, ncols=1, figsize=(7, 6.6), sharex=3, sharey=3,
                          proj=uplt.Proj('cyl', lon_0=180))
fig.set_facecolor('w')

ax = axes[0]
p = ax.contourf(u.lon, u.lat, vor[0]*1e5, cmap='bwr',
                levels=np.linspace(-10, 10, 22))
ax.set_title('relative vorticity', fontsize=fontsize)
ax.colorbar(p, loc='r', label='', ticks=2, length=0.98)

ax = axes[1]
p = ax.contourf(u.lon, u.lat, sf[0], levels=30, cmap='jet')
ax.quiver(u.lon.values, u.lat.values, u.values, v.values,
              width=0.0007, headwidth=12., headlength=15.)
              # headwidth=1, headlength=3, width=0.002)
ax.set_title('wind field and inverted streamfunction', fontsize=fontsize)
ax.colorbar(p, loc='r', label='', length=0.98)

axes.format(abc='(a)', coast=True, grid=False, labels=False,
            lonlines=60, latlines=30, lonlabels='b', latlabels='l')
/home/qianyk/miniconda3/envs/py13/lib/python3.13/site-packages/cartopy/crs.py:546: UserWarning: Some vectors at source domain corners may not have been transformed correctly
  warnings.warn('Some vectors at source domain corners '
[11]:
<matplotlib.colorbar.Colorbar at 0x7697926c2850>

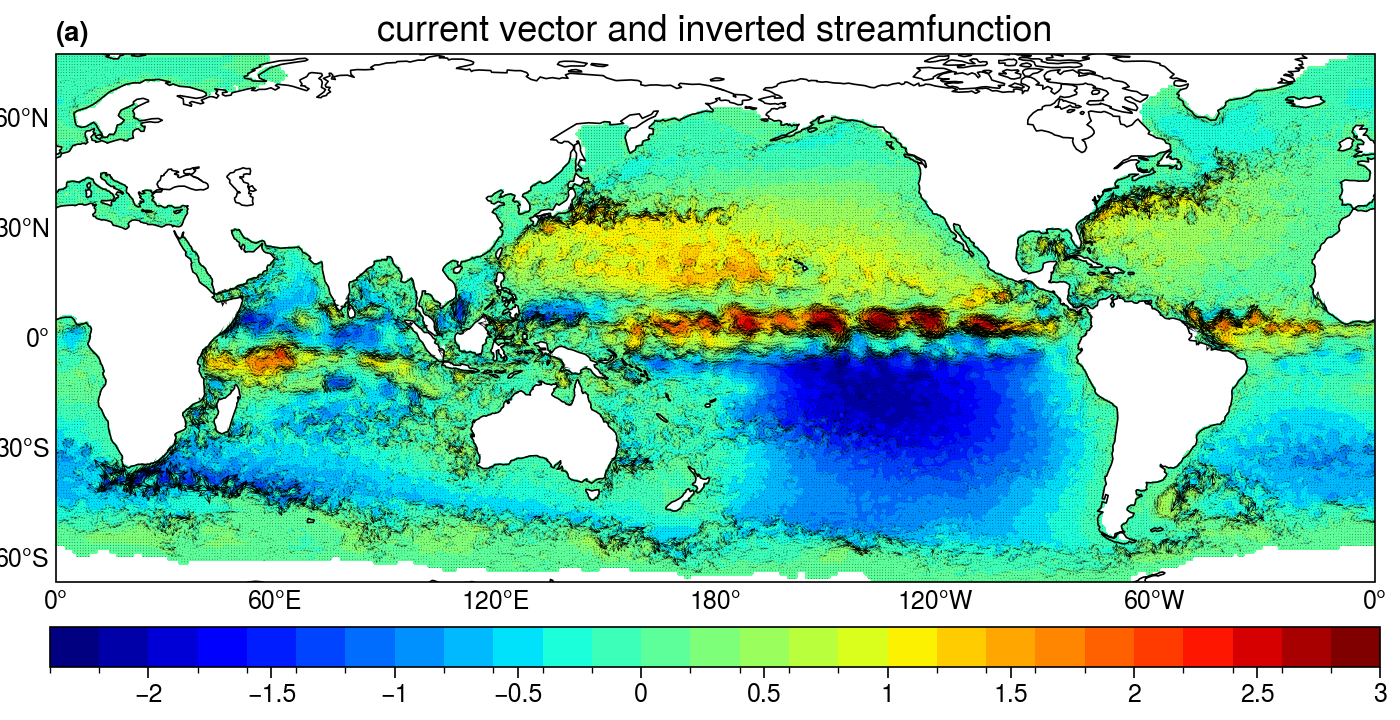
2.2 Oceanic demonstration
Here is a oceanic demonstration with complex lateral boundaries of land/sea. Read in data from MITgcm model output and then invert similarly as:
[13]:
import xarray as xr
import sys
sys.path.append('../../../')
from xinvert import invert_Poisson

ds = xr.open_dataset('../../../Data/Helmholtz_ocean.nc', decode_timedelta=False)
print(ds)

vor = ds.vor

iParams = {
    'BCs'      : ['extend', 'periodic'],
    'mxLoop'   : 1000,
    'tolerance': 1e-12,
    'undef'    : 0,
}

sf = invert_Poisson(vor, dims=['YG','XG'], coords='lat-lon', iParams=iParams)
<xarray.Dataset> Size: 12MB
Dimensions:  (XG: 1440, time: 1, YG: 720, YC: 720, XC: 1440)
Coordinates:
  * XG       (XG) float32 6kB 0.0 0.25 0.5 0.75 1.0 ... 359.0 359.2 359.5 359.8
    iter     (time) int32 4B ...
  * time     (time) int64 8B 0
  * YG       (YG) float32 3kB -89.88 -89.62 -89.38 -89.12 ... 89.38 89.62 89.88
  * YC       (YC) float32 3kB -89.75 -89.5 -89.25 -89.0 ... 89.5 89.75 90.0
  * XC       (XC) float32 6kB 0.125 0.375 0.625 0.875 ... 359.4 359.6 359.9
Data variables:
    vor      (time, YG, XG) float32 4MB ...
    UVEL     (time, YC, XG) float32 4MB ...
    VVEL     (time, YG, XC) float32 4MB ...
{time: 0} loops 1000 and tolerance is 3.760876e-06
The result can be visualized as:
[20]:
import ultraplot as uplt
import xarray as xr
import numpy as np

# deal with staggered velocity data
u = ds.UVEL[0]
v = ds.VVEL[0].rename({'YG':'YC', 'XC':'XG'}).interp_like(u)
m = np.hypot(u, v)
fontsize = 13

fig, axes = uplt.subplots(nrows=1, ncols=1, figsize=(7, 3.6), sharex=3, sharey=3,
                          proj=uplt.Proj('cyl', lon_0=180), facecolor='w')
fig.set_facecolor('w')

u = u.where(u!=0)
v = v.where(v!=0)
sf = sf.where(sf!=0)

ax = axes[0]
skip = 3
p = ax.contourf(u.XG, u.YC, sf[0]/1e5, levels=31, cmap='jet')
ax.quiver(u.XG.values[::skip], u.YC.values[::skip],
              u.values[::skip,::skip], v.values[::skip,::skip],
              width=0.0006, headwidth=12., headlength=15.)
ax.set_title('current vector and inverted streamfunction', fontsize=fontsize)
ax.set_ylim([-66, 78])
ax.set_xlim([-180, 180])
ax.colorbar(p, loc='b', label='', ticks=0.5)

axes.format(abc='(a)', coast=True, lonlines=60, latlines=30,
            lonlabels='b', latlabels='l', grid=False, labels=False)
3.3 Animate the convergence of iteration
It is interesting to see the whole convergence process of SOR iteration as:
[21]:
from xinvert import animate_iteration

ds = xr.open_dataset('../../../Data/Helmholtz_atmos.nc', decode_timedelta=False)

vor = ds.vor[0]
div = ds.div[0]

iParams = {'BCs': ['extend', 'periodic']}

sf = animate_iteration('Poisson', vor, dims=['lat','lon'], iParams=iParams, loop_per_frame=1, max_frames=40)
vp = animate_iteration('Poisson', div, dims=['lat','lon'], iParams=iParams, loop_per_frame=1, max_frames=40)

print(sf)
<xarray.DataArray 'inverted' (iter: 40, lat: 73, lon: 144)> Size: 2MB
array([[[ 1.21079272e+03,  2.04934351e+03,  2.69389746e+03, ...,
          7.06387188e+04,  6.96786172e+04,  6.98370625e+04],
        [ 6.95037031e+04,  6.86984141e+04,  6.74619609e+04, ...,
          1.46452188e+05,  1.46202156e+05,  1.45397828e+05],
        [ 3.39279906e+05,  3.30957656e+05,  3.20265031e+05, ...,
          6.66220312e+05,  6.57323625e+05,  6.44345938e+05],
        ...,
        [-2.73618219e+05, -3.02352719e+05, -3.27737000e+05, ...,
         -4.60758219e+05, -5.15555844e+05, -5.66083000e+05],
        [-2.95975293e+04, -3.43924844e+04, -3.88789219e+04, ...,
         -3.31875938e+04, -4.17470820e+04, -5.01223242e+04],
        [-2.58470435e+03, -5.14676367e+03, -7.48504004e+03, ...,
         -1.67538457e+04, -1.94566055e+04, -2.45968906e+04]],

       [[ 1.43960844e+05,  1.41778031e+05,  1.39085266e+05, ...,
          2.28665297e+05,  2.27929344e+05,  2.26463016e+05],
        [ 2.24059156e+05,  2.20791859e+05,  2.16649656e+05, ...,
          3.16209375e+05,  3.15125531e+05,  3.12978969e+05],
        [ 8.66340812e+05,  8.34294688e+05,  7.97991625e+05, ...,
          1.15410162e+06,  1.12400188e+06,  1.08830375e+06],
...
         -6.07238688e+05, -1.55768391e+05,  3.10296031e+05],
        [-1.16382930e+05,  1.97078438e+04,  1.59971266e+05, ...,
         -5.29258000e+05, -4.01984594e+05, -2.70236969e+05],
        [-9.36473281e+04,  3.79599727e+04,  1.72749578e+05, ...,
         -5.02714750e+05, -3.77053188e+05, -2.48501359e+05]],

       [[-3.96258125e+04, -8.80022344e+04, -1.30169852e+05, ...,
          1.56069141e+05,  9.76500625e+04,  4.39433828e+04],
        [-4.52389551e+03, -4.72854883e+04, -8.39210938e+04, ...,
          1.80806875e+05,  1.27577328e+05,  7.93381172e+04],
        [ 2.36021504e+04, -1.49914756e+04, -5.70001758e+04, ...,
          2.40771953e+05,  1.97137062e+05,  1.54980984e+05],
        ...,
        [ 8.37825375e+05,  1.30104862e+06,  1.75140125e+06, ...,
         -5.08202938e+05, -4.64657969e+04,  4.19666125e+05],
        [-1.44356625e+05,  3.04971875e+03,  1.55076797e+05, ...,
         -5.73053812e+05, -4.37937969e+05, -2.96237156e+05],
        [-1.33595562e+05,  7.95495264e+03,  1.54149125e+05, ...,
         -5.53279125e+05, -4.22732500e+05, -2.86433531e+05]]],
      shape=(40, 73, 144), dtype=float32)
Coordinates:
    time     datetime64[ns] 8B 2008-01-01
  * lat      (lat) float32 292B -90.0 -87.5 -85.0 -82.5 ... 82.5 85.0 87.5 90.0
  * lon      (lon) float32 576B 0.0 2.5 5.0 7.5 10.0 ... 350.0 352.5 355.0 357.5
  * iter     (iter) int64 320B 1 2 3 4 5 6 7 8 9 ... 32 33 34 35 36 37 38 39 40
The iteration dimension is added to indicate how many iterations is used to reach the current state. This is also the dimension that one may animate over using animation-making tools such as xmovie. Here we only show the result as: