Poisson equation (vertical cases)
21 September 2022 by MiniUFO
1. Introduction
A streamfunction \(\psi\) as well as vorticity \(\zeta\) can also be defined in meridional (\(y-z\)) plane or zonal (\(x-z\)) plane. In the meridional plane, \(\psi\) is also named as meridional overturning circulation, and in the zonal plane,usually the equatorial plane, \(\psi\) is also named as Walker circulation.
2. Example:
2.1 Meridional case
Here we first demonstrate the meridional case, in which meridional overturning streamfunction is inverted. Note that we use FiniteDiff to compute the vorticity in the meridional section (i.e., \(i\)-component of vorticity vector).
[1]:
import sys
sys.path.append('../../../')
import xarray as xr
import numpy as np
from xinvert import invert_Poisson, cal_flow, FiniteDiff

# load data
ds = xr.open_dataset('../../../Data/ZonalMean.nc')

v = ds.vm
w = ds.wm

# calculate vor in meridional plane
fd = FiniteDiff({'Z':'LEV', 'Y':'lat'}, BCs={'Z':'fixed','Y':'fixed'}, coords='lat-lon')
vor = fd.vort(v=v, w=w, components='i')

# invert streamfunction and flow
iParams = {
    'BCs'      : ['fixed', 'extend'],
    'undef'    : np.nan,
    'mxLoop'   : 5000,
    'tolerance': 1e-13,
}

sf = invert_Poisson(vor, dims=['LEV','lat'], coords='z-lat', iParams=iParams)
vs, ws = cal_flow(sf, dims=['LEV', 'lat'], coords='z-lat', BCs=iParams['BCs'])
{} loops 190 and tolerance is 5.483916e-14
Plot the results:
[3]:
import ultraplot as uplt

Re  = 6371200      # earth radius
g   = 9.80665      # gravity acceleration
lev = ds.LEV / 100 # change unit to hPa
lat = ds.lat
const = 2 * np.pi * Re * np.cos(lat * np.pi / 180) / g # change unit of streamfunction to kg/s (atmospheric convention)

array = [
    [1, 1, 2, 2],
    [3, 3, 4, 4],
    [0, 5, 5, 0],
]

fig, axes = uplt.subplots(array, figsize=(7, 5.6), sharex=3, sharey=3, facecolor='w')
fig.set_facecolor('w')

fontsize = 12

ax = axes[0]
m=ax.contourf(lat, lev, v, levels=np.linspace(-3.4, 3.4, 34), extend='both')
ax.colorbar(m, loc='r', label='', ticks=1)
ax.set_title('original v', fontsize=fontsize)
ax.set_ylabel('')
ax.set_xlabel('')

ax = axes[1]
m=ax.contourf(lat, lev, w, levels=np.linspace(-0.05, 0.05, 20), extend='both')
ax.colorbar(m, loc='r', label='', ticks=0.02)
ax.set_title('original w', fontsize=fontsize)
ax.set_ylabel('')
ax.set_xlabel('')

ax = axes[2]
m=ax.contourf(lat, lev, vs, levels=np.linspace(-3.4, 3.4, 34), extend='both')
ax.colorbar(m, loc='r', label='', ticks=1)
ax.set_title('rotational v', fontsize=fontsize)
ax.set_ylabel('')
ax.set_xlabel('')

ax = axes[3]
m=ax.contourf(lat, lev, ws, levels=np.linspace(-0.05, 0.05, 20), extend='both')
ax.colorbar(m, loc='r', label='', ticks=0.02)
ax.set_title('rotational w', fontsize=fontsize)
ax.set_ylabel('')
ax.set_xlabel('')

ax = axes[4]
m=ax.contourf(lat, lev, (sf * -const) / 1e10, levels=21)
ax.colorbar(m, loc='r', label='$10^{10}$ kg/s')
ax.quiver(lat, lev, vs, ws*-50, scale=50)
ax.set_title('streamfunction and vector', fontsize=fontsize)
ax.set_ylabel('Pressure (hPa)', fontsize=fontsize-2)
ax.set_xlabel('Latitude', fontsize=fontsize-2)

axes.format(abc='(a)', xlim=[0, 90])
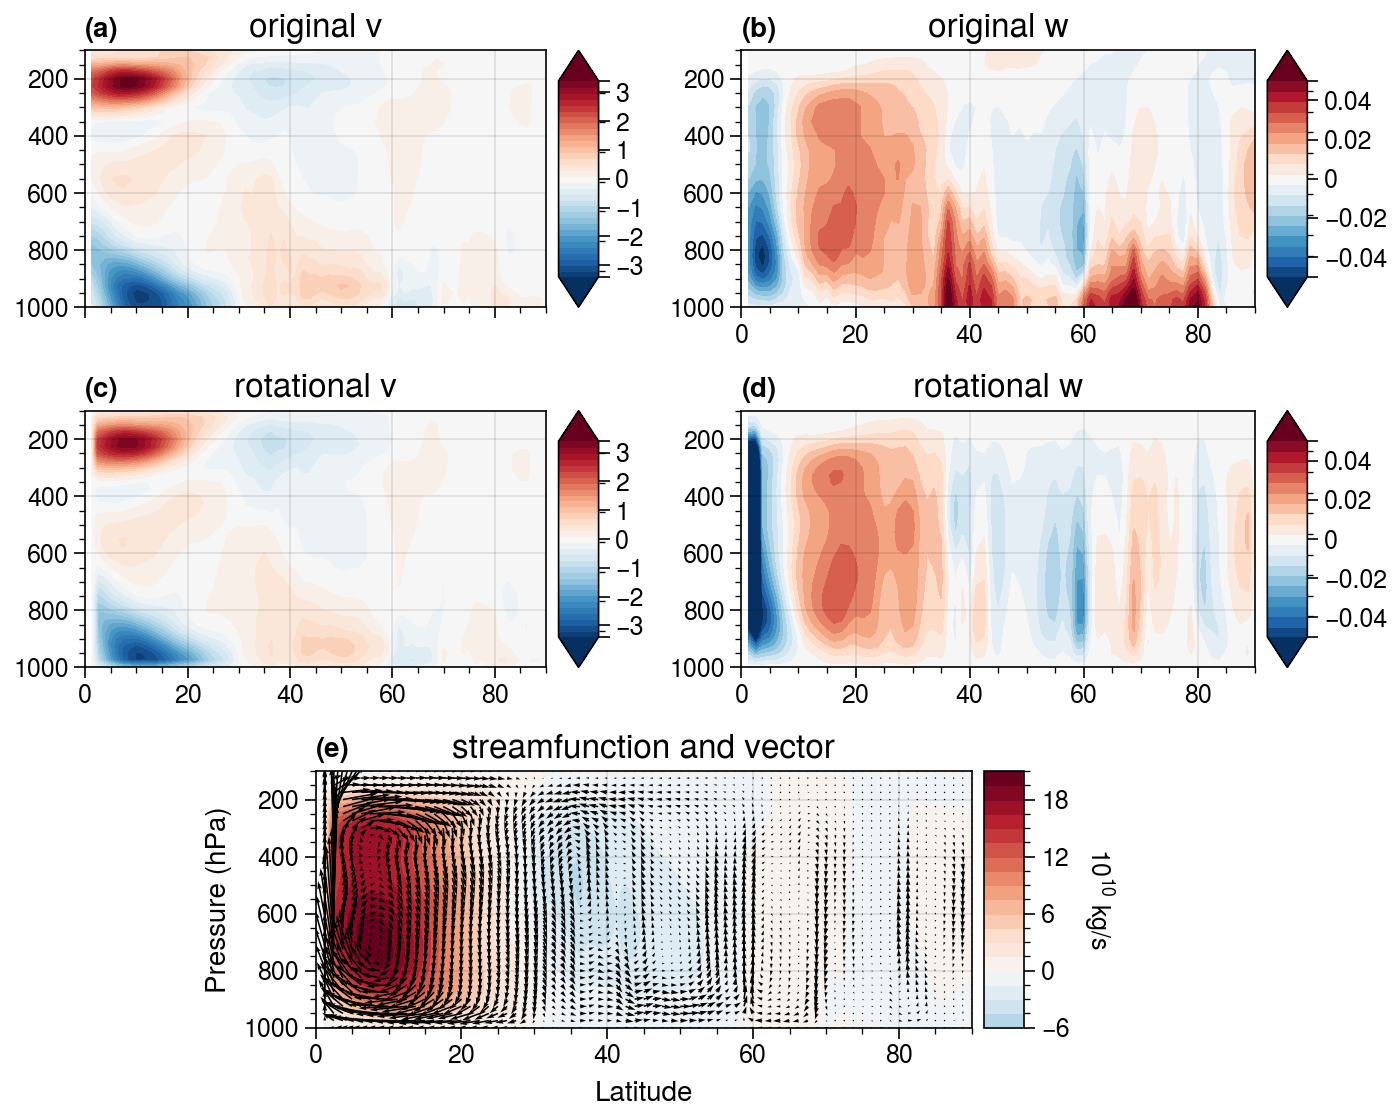
It is clear to see a strong tropical branch of Hadley cell, a weak Ferrel cell, and a weakest polar cell.
2.2 Zonal case
Here we demonstrate the zonal case, in which Walker circulation streamfunction is inverted. We also use FiniteDiff to compute the vorticity in the zonal section (i.e., \(j\)-component of vorticity vector).
[5]:
import xarray as xr
import numpy as np
from xinvert import invert_Poisson, cal_flow, FiniteDiff

ds = xr.open_dataset('../../../Data/atmos3D.nc', decode_timedelta=False)
ds['LEV'] = ds['LEV'] * 100 # hPa to Pa

u = ds.U.sel(lat=slice(10, -10)).mean('lat')
w = ds.Omega.sel(lat=slice(10, -10)).mean('lat')

fd = FiniteDiff({'Z':'LEV', 'Y':'lat', 'X':'lon'}, BCs={'Z':'fixed', 'Y':'fixed', 'X':'periodic'}, coords='lat-lon')
vor = fd.vort(u=u, w=w, components='j')

iParams = {
    'BCs'      : ['fixed', 'periodic'],
    'undef'    : np.nan,
    'mxLoop'   : 5000,
    'tolerance': 1e-13,
}

sf = invert_Poisson(vor, dims=['LEV','lon'], coords='z-lon', iParams=iParams)
us, ws = cal_flow(sf, dims=['LEV','lon'], coords='z-lon', BCs=['fixed', 'periodic'])
{} loops 222 and tolerance is 9.571825e-14
The result can be visualized as:
[7]:
import ultraplot as uplt

Re    = 6371200        # earth radius
g     = 9.80665        # gravitational acceleration
lev   = ds.LEV / 100   # change unit to hPa
lon   = ds.lon
const = 2 * np.pi * Re / g  # change unit of streamfunction to kg/s (atmospheric convention)

array = [
    [1, 1, 2, 2],
    [3, 3, 4, 4],
    [0, 5, 5, 0],
]

fig, axes = uplt.subplots(array, figsize=(7, 5.6), sharex=3, sharey=3, facecolor='w')
fig.set_facecolor('w')

fontsize = 12

ax = axes[0]
m=ax.contourf(lon, lev, u, levels=np.linspace(-16, 16, 32), extend='both')
ax.colorbar(m, loc='r', label='', ticks=4)
ax.set_title('original u', fontsize=fontsize)
ax.set_ylabel('')
ax.set_xlabel('')

ax = axes[1]
m=ax.contourf(lon, lev, w, levels=np.linspace(-0.06, 0.06, 22), extend='both')
ax.colorbar(m, loc='r', label='', ticks=0.02)
ax.set_title('original w', fontsize=fontsize)
ax.set_ylabel('')
ax.set_xlabel('')

ax = axes[2]
m=ax.contourf(lon, lev, us, levels=np.linspace(-16, 16, 32), extend='both')
ax.colorbar(m, loc='r', label='', ticks=4)
ax.set_title('rotational u', fontsize=fontsize)
ax.set_ylabel('')
ax.set_xlabel('')

ax = axes[3]
m=ax.contourf(lon, lev, ws, levels=np.linspace(-0.06, 0.06, 22), extend='both')
ax.colorbar(m, loc='r', label='', ticks=0.02)
ax.set_title('rotational w', fontsize=fontsize)
ax.set_ylabel('')
ax.set_xlabel('')

ax = axes[4]
m=ax.contourf(lon, lev, sf * const / 1e10, levels=21)
ax.colorbar(m, loc='r', label='$10^{10}$ kg/s')
ax.quiver(lon[::5], lev, us[:,::5], ws[:,::5]*-50, scale=250)
ax.set_title('streamfunction and vector', fontsize=fontsize)
ax.set_ylabel('Pressure (hPa)', fontsize=fontsize-2)
ax.set_xlabel('Latitude', fontsize=fontsize-2)

axes.format(abc='(a)', xlim=[0, 360], xticks=np.arange(0, 361, 60))
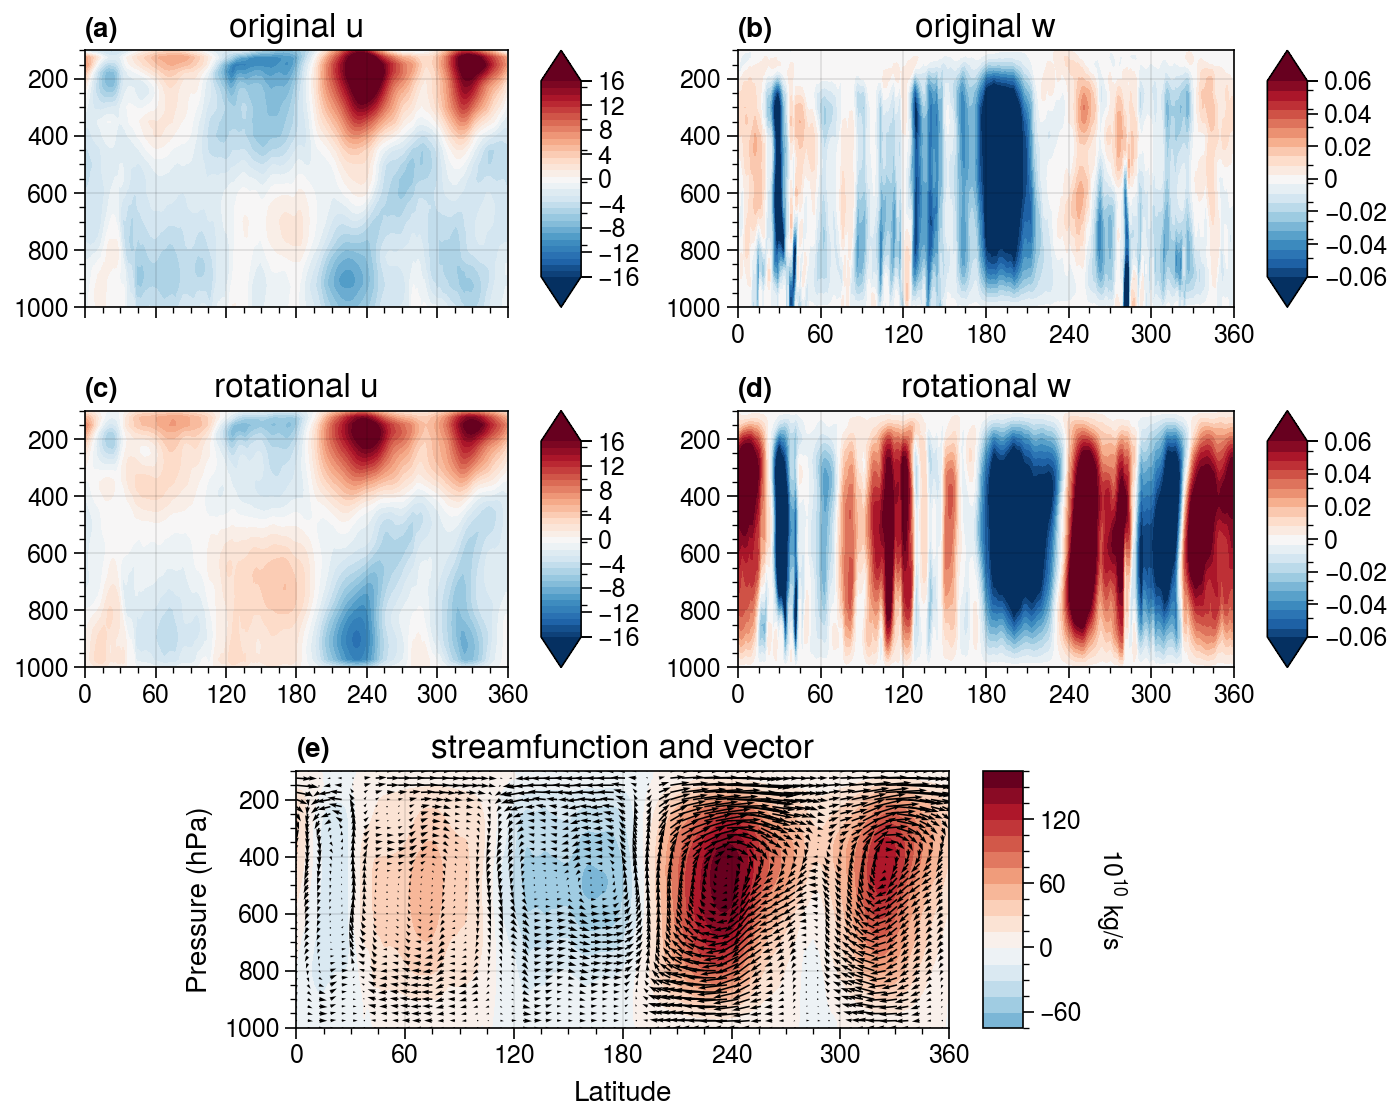
It is clear that there is a strong upward motion at central equatorial Pacific (near dateline). Since the boundary condition is fixed, the inverted flow cannot penetrated through the four boundaries.