Gill-Matsuno model
21 December 2020 by MiniUFO
[TOC]
1. Introduction
Gill-Matsuno model (Matsuno 1966; Gill 1980) is a classical model studying the tropical atmospheric response to a prescribed heating source. Inversion of the model means that we can obtain a steady-state response in terms of atmospheric flow and mass, given any kind of heating pattern. The model on the spherical earth can be written as:
where \(u\), \(v\), and \(\phi\) are the anomlous flow and mass responses relative to a reference state \(U\), \(V\), and \(\Phi\). Also, \(U\) and \(V\) are assumed to be zero (a motionless reference state). Given the diabatic heating field \(Q\), one will get the wind field (\(u\), \(v\)) and mass field \(\phi\).
2. Theory
Gill-Matsuno model is linear about three unknowns \(u\), \(v\) (horizontal flow), and \(\phi\) (geopotential). Using simple substitutions, one can obtain the explicit expressions of them as:
where \(\nabla=(\partial_x, \partial_y)\), \(\hat\nabla=(-\partial_y, \partial_x)\), \(c_1=\epsilon/(\epsilon^2+f^2)\) and \(c_2=f/(\epsilon^2+f^2)\). Equation (4) is an elliptic equation as long as \(\epsilon\), \(f\), and \(\Phi\) are all positive and that \(\epsilon\) is not much smaller than \(f\). In component form, Eq. (4) can be written as:
One can invert \(\phi\) using SOR method given \(Q\), and hence the wind field \(u\) and \(v\) using Eqs. (5) and (6). It can be changed slightly to fit into the general 2D solver as:
Although Eqs. (7) and (8) are equivalent, it is not clear which form is better for discretization and iteration. Here we choose the form of Eq. (8) for SOR.
3. Examples
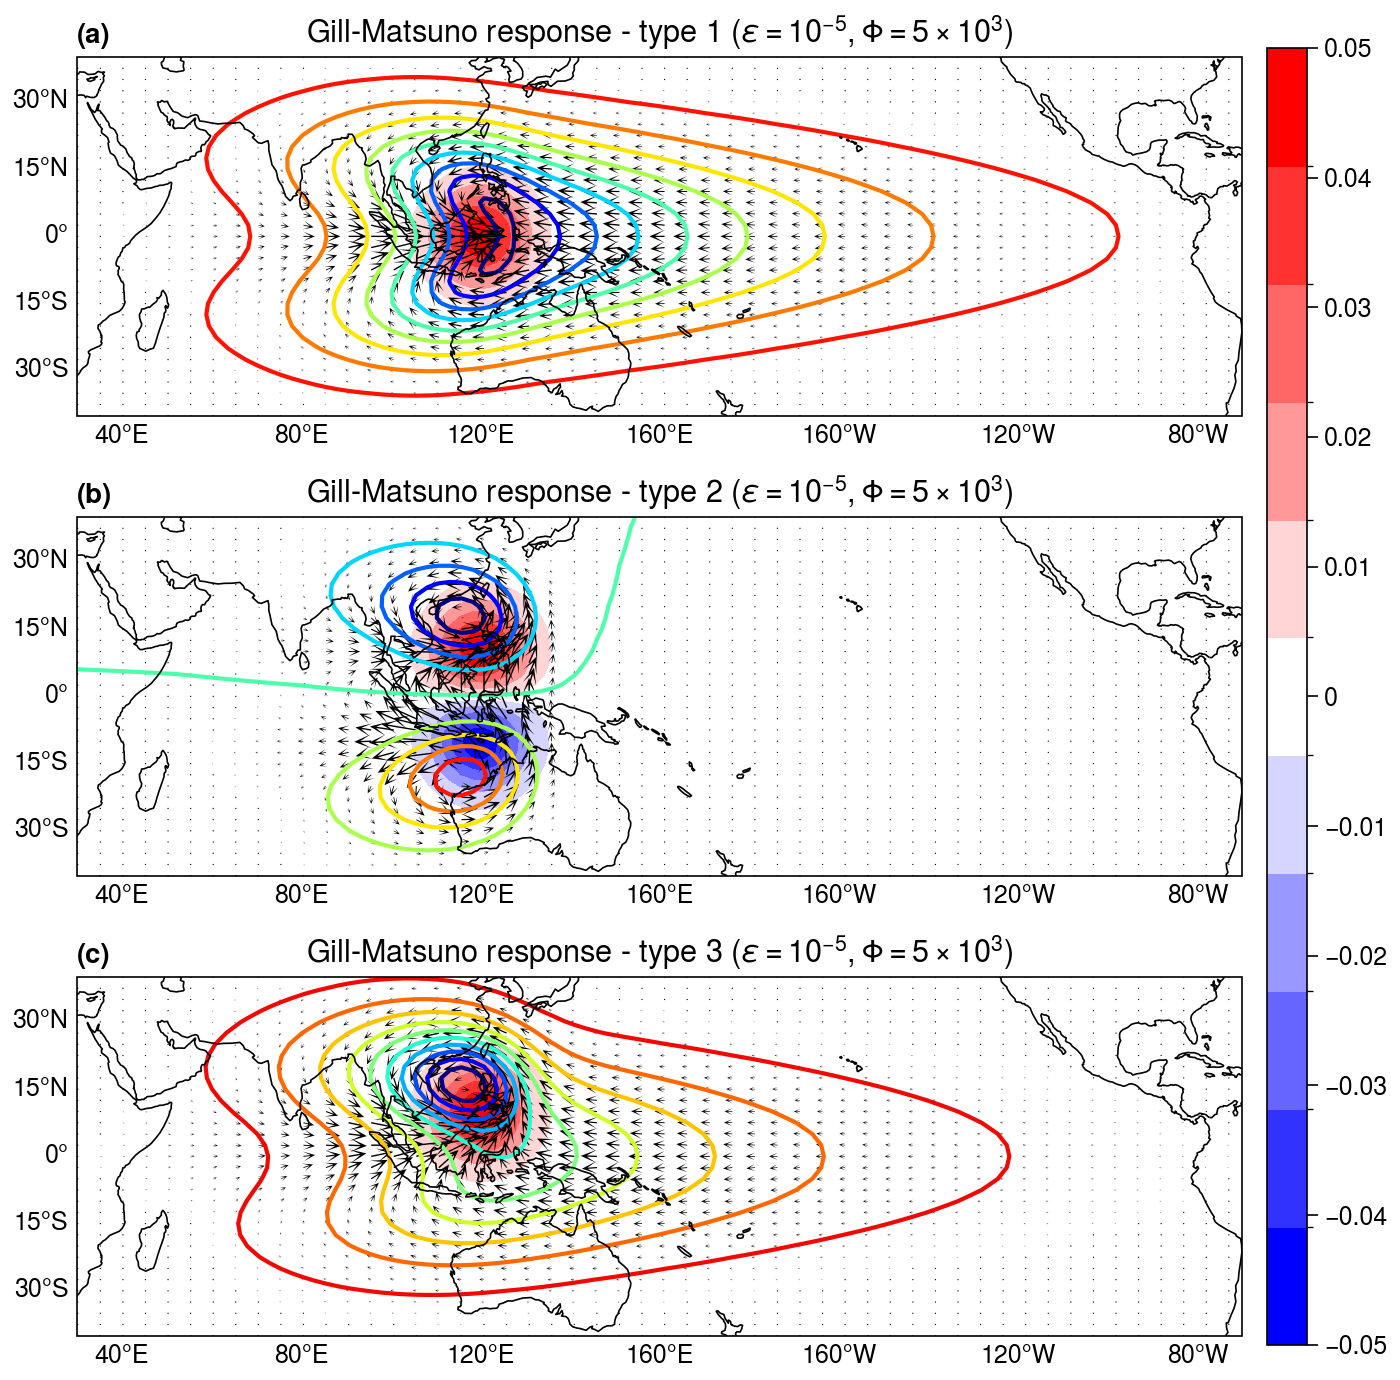
3.1 The classical Gill example
Gill has presented three classical atmospheric responses to different patterns of heating located at tropics in his 1980 paper. Here we recover his results using the SOR iteration. First, we load in data from a file with a lat/lon grid and specify the three types of heating:
[1]:
import sys
sys.path.append('../../../')
import numpy as np
import xarray as xr

lon = xr.DataArray(np.linspace(0, 360, 144), dims='lon', coords={'lon':np.linspace(0, 360, 144)})
lat = xr.DataArray(np.linspace(-90, 90, 73), dims='lat', coords={'lat':np.linspace(-90, 90, 73)})

lat, lon = xr.broadcast(lat, lon)

# three patterns of heating
Q1 = 0.05*np.exp(-((lat-0)**2+(lon-120)**2)/100.0)
Q2 = 0.05*np.exp(-((lat-10)**2+(lon-120)**2)/100.0) \
   - 0.05*np.exp(-((lat+10)**2+(lon-120)**2)/100.0)
Q3 = 0.05*np.exp(-((lat-10)**2+(lon-120)**2)/100.0)
Inverting the atmospheric responses in terms of mass h and wind field (u, v), within lat/lon plane, is as simple as:
[2]:
from xinvert import invert_GillMatsuno, cal_flow

iParams = {
    'BCs'      : ['fixed', 'periodic'],
    'mxLoop'   : 600,
    'tolerance': 1e-5,
    'optArg'   : 1.4,
}

mParams = {
    'epsilon': 1e-5,
    'Phi'    : 5000,
}

h1 = invert_GillMatsuno(Q1, dims=['lat','lon'], mParams=mParams, iParams=iParams)
h2 = invert_GillMatsuno(Q2, dims=['lat','lon'], mParams=mParams, iParams=iParams)
h3 = invert_GillMatsuno(Q3, dims=['lat','lon'], mParams=mParams, iParams=iParams)

u1, v1 = cal_flow(h1, dims=['lat','lon'], BCs=['fixed','periodic'], mParams=mParams, vtype='GillMatsuno')
u2, v2 = cal_flow(h2, dims=['lat','lon'], BCs=['fixed','periodic'], mParams=mParams, vtype='GillMatsuno')
u3, v3 = cal_flow(h3, dims=['lat','lon'], BCs=['fixed','periodic'], mParams=mParams, vtype='GillMatsuno')
{} loops  600 and tolerance is 5.608964e-05
{} loops   87 and tolerance is 4.905623e-06
{} loops  600 and tolerance is 5.174635e-05
Notice that this is a global case, in contrast to the original \(\beta\)-plane case. The result can be visualized as:
[5]:
#%% plot wind and streamfunction
import ultraplot as uplt
import matplotlib.pyplot as plt
import matplotlib.colors as mcolors

def maskout_cmap(cmap, clevs, maskout):
    for msk in maskout:
        if msk not in clevs:
            raise Exception('maskout {0} not in clevs {1}'.format(maskout, clevs))

    N = len(clevs) + 1

    colors = plt.get_cmap(cmap, N)  # define the colormap (even number)
    colors = [colors(i) for i in range(N)]

    if type(clevs) is list:
        clevsLst = clevs
    else:
        clevsLst = clevs.tolist()

    strIdx = clevsLst.index(maskout[0]) + 1
    endIdx = clevsLst.index(maskout[1]) + 1

    for i in range(strIdx, endIdx):
#        print(colors[i])
        colors[i] = np.array((1, 1, 1, 1))

    if len(colors) != N:
        print(len(colors))
        print(N)
        raise Exception('lengths not equal')

    # create the new map
    return mcolors.LinearSegmentedColormap.from_list('msk', colors, N)


lat, lon = xr.broadcast(u1.lat, u1.lon)

fig, axes = uplt.subplots(nrows=3, ncols=1, figsize=(7, 6.9), sharex=3, sharey=3,
                          proj=uplt.Proj('cyl', lon_0=180))
fig.set_facecolor('w')
skip = 1
fontsize = 11

cmap = maskout_cmap('bwr', [-0.05, -0.04, -0.03, -0.02, -0.01,  0.,
                     0.01,  0.02,  0.03,  0.04,  0.05], [-0.01, 0.01])

ax = axes[0]
ax.contourf(Q1, cmap=cmap, levels=np.linspace(-0.05, 0.05, 12))
ax.contour(h1, cmap='jet')
ax.set_title('Gill-Matsuno response - type 1 ($\\epsilon=10^{-5}, \\Phi=5\\times 10^3$)', fontsize=fontsize)
ax.quiver(lon.values[::skip,::skip+1], lat.values[::skip,::skip+1],
              u1.values[::skip,::skip+1], v1.values[::skip,::skip+1],
              width=0.0012, headwidth=10., headlength=12., scale=250)
              # headwidth=1, headlength=3, width=0.002)
ax.set_ylim([-40, 40])
ax.set_xlim([-150, 110])

ax = axes[1]
ax.contourf(Q2, cmap=cmap, levels=np.linspace(-0.05, 0.05, 12))
ax.contour(h2, cmap='jet')
ax.set_title('Gill-Matsuno response - type 2 ($\\epsilon=10^{-5}, \\Phi=5\\times 10^3$)', fontsize=fontsize)
ax.quiver(lon.values[::skip,::skip+1], lat.values[::skip,::skip+1],
              u2.values[::skip,::skip+1], v2.values[::skip,::skip+1],
              width=0.0012, headwidth=10., headlength=12., scale=250)
ax.set_ylim([-40, 40])
ax.set_xlim([-150, 110])

ax = axes[2]
p=ax.contourf(Q3, cmap=cmap, levels=np.linspace(-0.05, 0.05, 12))
ax.contour(h3, cmap='jet')
ax.set_title('Gill-Matsuno response - type 3 ($\\epsilon=10^{-5}, \\Phi=5\\times 10^3$)', fontsize=fontsize)
ax.quiver(lon.values[::skip,::skip+1], lat.values[::skip,::skip+1],
              u3.values[::skip,::skip+1], v3.values[::skip,::skip+1],
              width=0.0012, headwidth=10., headlength=12., scale=250)
ax.set_ylim([-40, 40])
ax.set_xlim([-150, 110])

fig.colorbar(p, loc='r', label='', rows=(1,3), ticks=0.01)

axes.format(abc='(a)', coast=True, lonlines=40, latlines=15, lonlabels='b', latlabels='l',
            grid=False, labels=False)
3.2 A realistic case
In this case, heating pattern is derived from the 30-60-day bandpass filtered OLR anomaly. We just want to see if the atmospheric response based on Gill-Matsuno model is close to the observed one. Read in data from a data file:
[6]:
import numpy as np
import xarray as xr

ds = xr.open_dataset('../../../Data/MJO.nc')

# observed h and u,v anomalies (30-60day filtered)
h_ob = ds.hl
u_ob = ds.ul
v_ob = ds.vl

# observed heating anomaly (30-60day filtered)
Q = (ds.ol*-0.0015).where(np.abs(ds.lat)<60, 0)
Inversion is simple as:
[7]:
iParams = {
    'BCs'      : ['fixed', 'periodic'],
    'mxLoop'   : 800,
    'tolerance': 1e-5,
    'optArg'   : 1.4,
}

mParams1 = {'epsilon': 1e-5, 'Phi': 5000}
mParams2 = {'epsilon': 7e-6, 'Phi': 8000}
mParams3 = {'epsilon': 7e-6, 'Phi': 10000}

h1 = invert_GillMatsuno(Q, dims=['lat','lon'], mParams=mParams1, iParams=iParams)
h2 = invert_GillMatsuno(Q, dims=['lat','lon'], mParams=mParams2, iParams=iParams)
h3 = invert_GillMatsuno(Q, dims=['lat','lon'], mParams=mParams3, iParams=iParams)

u1, v1 = cal_flow(h1, dims=['lat','lon'], BCs=['fixed','periodic'], mParams=mParams1, vtype='GillMatsuno')
u2, v2 = cal_flow(h2, dims=['lat','lon'], BCs=['fixed','periodic'], mParams=mParams2, vtype='GillMatsuno')
u3, v3 = cal_flow(h3, dims=['lat','lon'], BCs=['fixed','periodic'], mParams=mParams3, vtype='GillMatsuno')
{} loops  355 and tolerance is 9.992876e-06
{} loops  387 and tolerance is 9.715350e-06
{} loops  412 and tolerance is 9.790275e-06
Plot the results and compare them with the observed fields:
[10]:
lat, lon = xr.broadcast(ds.lat, ds.lon)

fig, axes = uplt.subplots(nrows=2, ncols=2, figsize=(7, 4.4), sharex=3, sharey=3,
                          proj=uplt.Proj('cyl', lon_0=180))
fig.set_facecolor('w')
skip = 1
fontsize = 11
cmap = maskout_cmap('bwr', [-0.1, -0.09, -0.08, -0.07, -0.06, -0.05,
                            -0.04, -0.03, -0.02, -0.01,  0., 0.01, 0.02,
                            0.03, 0.04, 0.05, 0.06, 0.07, 0.08, 0.09, 0.1],
                    [-0.01, 0.01])

ax = axes[0,0]
ax.contourf(Q, cmap=cmap, levels=np.linspace(-0.1, 0.1, 21))
ax.contour(h_ob, color='black', linewidth=1.2,
           levels=[-25, -20, -15, -10, -5, 0, 5, 10, 15, 20, 25])
ax.set_title('observed mass and wind anomalies', fontsize=fontsize)
ax.quiver(lon.values[::skip,::skip+1], lat.values[::skip,::skip+1],
              u_ob.values[::skip,::skip+1]*5, v_ob.values[::skip,::skip+1]*5,
              width=0.0016, headwidth=10., headlength=12., scale=300)
              # headwidth=1, headlength=3, width=0.002)
ax.set_ylim([-30, 30])
ax.set_xlim([-160, -20])

ax = axes[0,1]
ax.contourf(Q, cmap=cmap, levels=np.linspace(-0.1, 0.1, 21))
ax.contour(h1, color='black', linewidth=1.2, levels=11)
ax.set_title('response ($\\epsilon=10^{-5}, \\Phi=5\\times 10^3$)', fontsize=fontsize)
ax.quiver(lon.values[::skip,::skip+1], lat.values[::skip,::skip+1],
              u1.values[::skip,::skip+1], v1.values[::skip,::skip+1],
              width=0.0016, headwidth=10., headlength=12., scale=300)
              # headwidth=1, headlength=3, width=0.002)
ax.set_ylim([-30, 30])
ax.set_xlim([-160, -20])

ax = axes[1,0]
ax.contourf(Q, cmap=cmap, levels=np.linspace(-0.1, 0.1, 21))
ax.contour(h2, color='black', linewidth=1.2, levels=11)
ax.set_title('response ($\\epsilon=7\\times 10^{-6}, \\Phi=5\\times 10^3$)', fontsize=fontsize)
ax.quiver(lon.values[::skip,::skip+1], lat.values[::skip,::skip+1],
              u2.values[::skip,::skip+1], v2.values[::skip,::skip+1],
              width=0.0016, headwidth=10., headlength=12., scale=300)
ax.set_ylim([-30, 30])
ax.set_xlim([-160, -20])

ax = axes[1,1]
p=ax.contourf(Q, cmap=cmap, levels=np.linspace(-0.1, 0.1, 21))
ax.contour(h3, color='black', linewidth=1.2, levels=11)
ax.set_title('response ($\\epsilon=7\\times 10^{-6}, \\Phi=10^4$)', fontsize=fontsize)
ax.quiver(lon.values[::skip,::skip+1], lat.values[::skip,::skip+1],
              u3.values[::skip,::skip+1], v3.values[::skip,::skip+1],
              width=0.0016, headwidth=10., headlength=12., scale=300)
ax.set_ylim([-30, 30])
ax.set_xlim([-160, -20])

fig.colorbar(p, loc='b', label='heating Q', ticks=0.02, length=1)

axes.format(abc='(a)', coast=True, grid=False, labels=False,
            lonlines=20, latlines=10, lonlabels='b', latlabels='l')
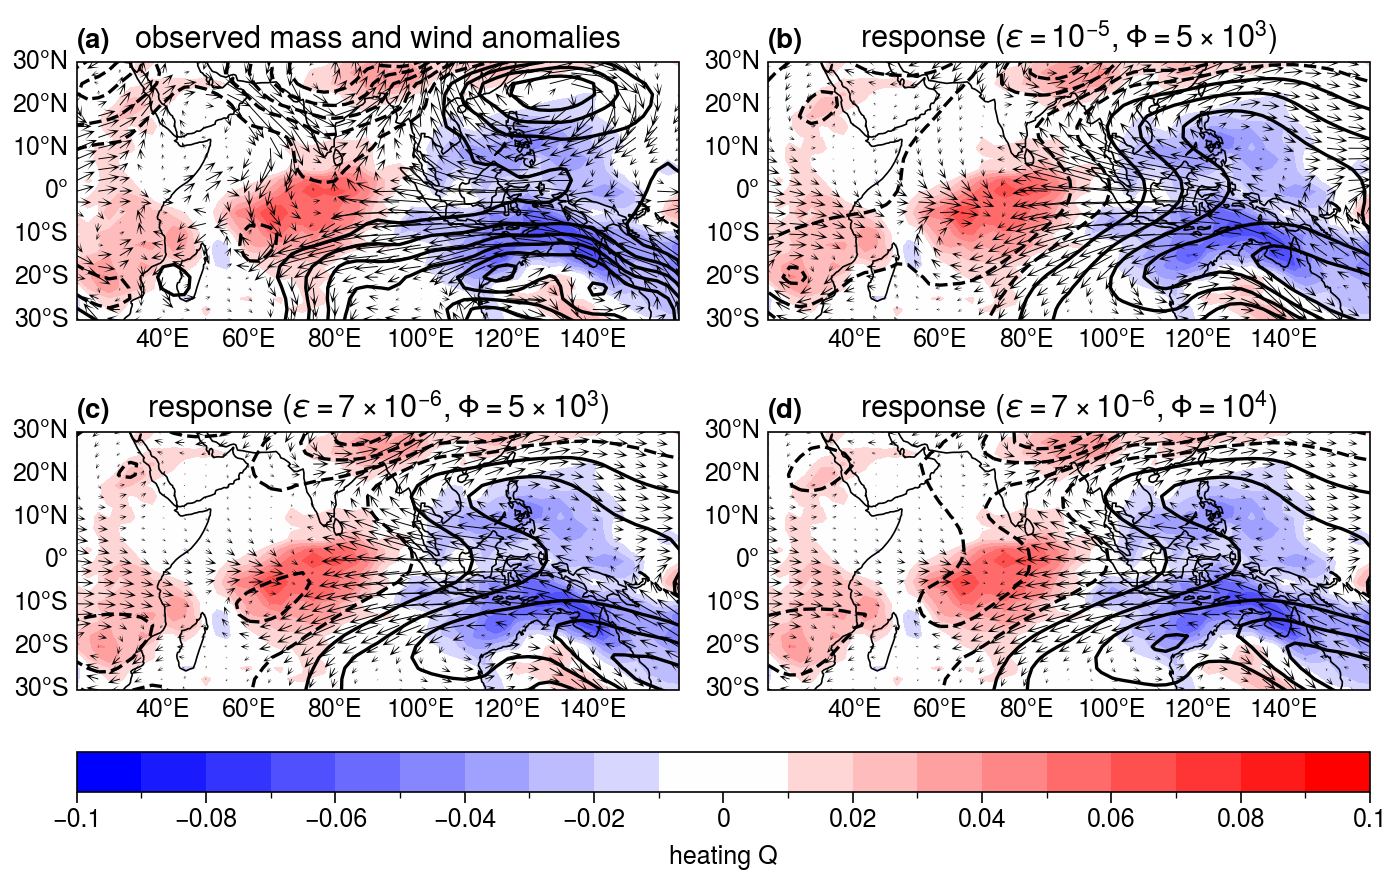
It is clear that such simple model has reproduced much of the observed signals, albeit some displacement of the response centers.
References
Matsuno, T., 1966: Quasi-Geostrophic Motions in the Equatorial Area. Journal of the Meteorological Society of Japan, 44, 25-43.
Gill, A. E., 1980: Some Simple Solutions for Heat-Induced Tropical Circulation. Quarterly Journal of the Royal Meteorological Society, 106, 447-462.